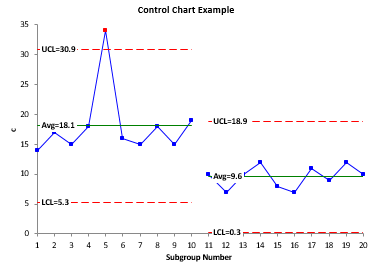
With Control Charts in SPC for Excel You Can:

- Show that your process is in statistical control
- Easily add new data to update the control chart
- Split the control limits to show process improvements
- Lock the control limits in place for future data
- and much more!
See What Control Charts in SPC for Excel Can Do!
Why Use Control Charts in SPC for Excel?
Our goal has been to create a control chart software package that gives you all the options you need to determine if your process is in statistical control, and to improve and manage your processes.
- The SPC for Excel software has over 30 different charts
- Large number of options to meet each of your process improvement needs
- Easy select and create charts in Excel
- Add data, update and share your work
- Multiple tools for data analysis, simple yet powerful
From Our Satisfied Customers
"Love that there are a full range of control charts in there – and it is simple to use. This was the reason I wanted our organization to purchase your product – cost effective, useful and easy to use. I also love the website which is full of useful information especially relating to when and how to use a control chart – and you include examples from healthcare! This is often so hard to find – and healthcare is such a different industry than say, manufacturing, sometimes it is hard to see where a control chart may assist in quality improvement and monitoring."
- Sara M.
Join Those in Over 80 Countries Using SPC for Excel!
30+ Control Charts in SPC for Excel
|
Subgroup Averages
|
Individuals
|
|
Between/With
|
Time Weighted
|
|
Multivariate
|
Attributes
|
SPC for Excel is more than just control charts. Over the years, we have added many additional tools making our software a great tool for anyone who wants to improve their data analysis.

