SPC for Excel Software for Windows PC and Mac!
SPC for Excel Software simplifies statistical charting and analysis. The SPC software helps you identify problem areas, gain insights to your data, spot trends, solve problems and improve processes all in the familiar environment of Excel. Whether you are a seasoned Black Belt or a novice, interested in Lean Six Sigma or process improvements, this software is for you.
- Process Capability analysis - to meet your customer needs
- Control Charts and Histograms - to manage your processes
- Gage R&R Study – to validate your measurement system
- Problem Solving Tools (Pareto, histogram, scatter, and more)l - to help your team solve problems
- Advanced Data Analysis Tools (DOE, ANOVA, distribution fitting, regression, hypotheses testing, and more) – to meet your advanced needs
SPC for Excel - Simple but Powerful!
Why Should I Select SPC for Excel Over Other SPC Software?
- Simple, Affordable yet Powerful!
- Quick learning curve with Getting Started Guide, how-to videos, example data files and on-line help
- Runs in the familiar Excel environment
- Contains 100% of the statistical analysis tools that 95% of the people need
- Costs a fraction of major statistical software packages
- Free technical support, free builds, and no maintenance fees
- Install on your desktop computer and laptop
From Our Satisfied Customers
"As a Six Sigma Black Belt I have used this great tool to support the completion of numerous projects. It is versatile as well as highly capable. This version has phenomenal enhancements that will make stronger analytical tools available to anyone with Excel. Way to go, SPC for Excel."
—Walt Wilson, Certified Six Sigma Black Belt
Start your free trial now to see why professionals world-wide have chosen SPC for Excel!
SPC for Excel Software - Easily Create Charts
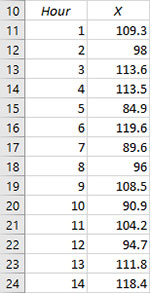
1) Enter Your Data
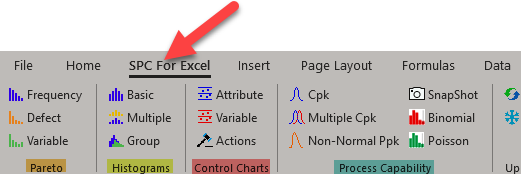
2) Select Your Option From The SPC for Excel Ribbon

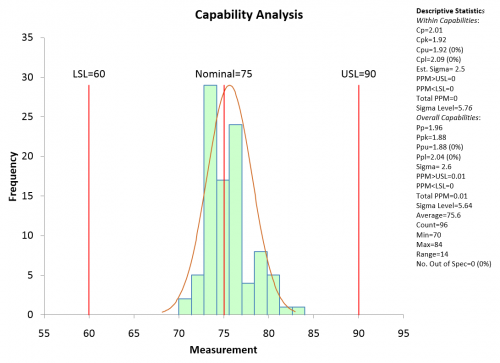
3) SPC for Excel Creates the Chart & Statistics
Statistical Tools Included in SPC for Excel
- Pareto Charts
- Histograms
- Control Charts
- Process Capability
- Scatter Diagrams
- Measurement Systems Analysis
- Regression
- Fishbone Diagram
- Experimental Design
- ANOVA
- ANOM
- ANOX
- Normal Probability Plot
- Data Transformation
- Distribution Fitting
- Descriptive Statistics
- Samples Tests
- Test for Multiple Processes
- Correlation
- NonParameteric Analysis
Join the Thousands of Organizations in Over 80 Countries Who Use SPC for Excel to Chart, Analyze and Improve. Manufacturers, Businesses and Education.


