June 2011
You have a set of data. You would like to know if it fits a certain distribution - for example, the normal distribution. Maybe there are a number of statistical tests you want to apply to the data but those tests assume your data are normally distributed? How can you determine if the data are normally distributed. You can construct a histogram and see if it looks like a normal distribution. You could also make a normal probability plot and see if the data falls in a straight line. We have past newsletters on histograms and making a normal probability plot. There is an additional test you can apply. It is called the Anderson-Darling test and is the subject of this month's newsletter.
We have included an Excel workbook that you can download to perform the Anderson-Darling test for up to 200 data points. It includes a normal probability plot.
In this issue:
- The Anderson-Darling Test Hypotheses
- Two Data Sets
- The Anderson-Darling Test
- The p Value for the Adjusted Anderson-Darling Statistic
- Applying the Anderson-Darling Test
- Summary
- Quick Links
You can download the workbook containing the data at this link.
The Anderson-Darling Test Hypotheses
The Anderson-Darling Test was developed in 1952 by Theodore Anderson and Donald Darling. It is a statistical test of whether or not a dataset comes from a certain probability distribution, e.g., the normal distribution. The test involves calculating the Anderson-Darling statistic. You can use the Anderson-Darling statistic to compare how well a data set fits different distributions.
The two hypotheses for the Anderson-Darling test for the normal distribution are given below:
H0: The data follows the normal distribution
H1: The data do not follow the normal distribution
The null hypothesis is that the data are normally distributed; the alternative hypothesis is that the data are non-normal.
In many cases (but not all), you can determine a p value for the Anderson-Darling statistic and use that value to help you determine if the test is significant are not. Remember the p ("probability") value is the probability of getting a result that is more extreme if the null hypothesis is true. If the p value is low (e.g., <=0.05), you conclude that the data do not follow the normal distribution. Remember that you chose the significance level even though many people just use 0.05 the vast majority of the time. We will look at two different data sets and apply the Anderson-Darling test to both sets.
Two Data Sets
The first data set comes from Mater Mother's Hospital in Brisbane, Australia. The data set contains the birth weight, gender, and time of birth of 44 babies born in the 24-hour period of 18 December 1997. The data were explained using four different distributions. We will focus on using the normal distribution, which was applied to the birth weights. The data are shown in the table below.
Table of Birth Weights (Grams)
| 3837 | 3480 |
| 3334 | 3116 |
| 3554 | 3428 |
| 3838 | 3783 |
| 3625 | 3345 |
| 2208 | 3034 |
| 1745 | 2184 |
| 2846 | 3300 |
| 3166 | 2383 |
| 3520 | 3428 |
| 3380 | 4162 |
| 3294 | 3630 |
| 2576 | 3406 |
| 3208 | 3402 |
| 3521 | 3500 |
| 3746 | 3736 |
| 3523 | 3370 |
| 2902 | 2121 |
| 2635 | 3150 |
| 3920 | 3866 |
| 3690 | 3542 |
| 3430 | 3278 |
The second set of data involves measuring the lengths of forearms in adult males. The 140 data values are in inches. The data is given in the table below.
Table of Forearm Lengths
| 17.3 | 20.9 | 18.7 | 17.9 | 18.3 |
| 19 | 18.1 | 18.8 | 19.1 | 17.9 |
| 18.2 | 19.4 | 19.4 | 17.3 | 18.3 |
| 19 | 20.5 | 18.5 | 19.4 | 19.6 |
| 19 | 20.4 | 18.6 | 18.3 | 19.6 |
| 20.4 | 16.1 | 19.6 | 19.3 | 21 |
| 18.3 | 18.7 | 18.5 | 17.2 | 18 |
| 19.9 | 18.8 | 20 | 17.5 | 17.9 |
| 18.7 | 17.3 | 17.8 | 19.6 | 18.1 |
| 20.9 | 18.1 | 19.8 | 17.6 | 19.5 |
| 17.7 | 19.9 | 16.6 | 20 | 17.1 |
| 19.1 | 19.6 | 19.4 | 19.9 | 18.9 |
| 19.7 | 18.4 | 19.3 | 16.9 | 18.5 |
| 18.1 | 19.5 | 20.1 | 19.5 | 19.2 |
| 18.4 | 16.8 | 20.5 | 20.4 | 20.5 |
| 17.5 | 17.1 | 20 | 19.1 | 18.3 |
| 18.9 | 18.9 | 20.8 | 18.5 | 19.4 |
| 19 | 19.7 | 17.7 | 18.3 | 21.4 |
| 20.5 | 19.7 | 19.9 | 19.8 | 19 |
| 17.3 | 19.2 | 18.8 | 19.1 | 18.6 |
| 18.3 | 20.6 | 16.4 | 17.5 | 19.5 |
| 18.4 | 20.1 | 18.5 | 18.5 | 17.4 |
| 18.6 | 18.8 | 19 | 19.3 | 18.5 |
| 19.8 | 17.1 | 20.6 | 19.1 | 18.4 |
| 20.2 | 18.6 | 19.2 | 17.4 | 18.3 |
| 18.5 | 18 | 17.1 | 16.3 | 20.7 |
| 18.5 | 18.7 | 16.3 | 18.2 | 19.3 |
| 18 | 20.3 | 17.2 | 18.8 | 17.7 |
The Anderson-Darling Test
The Anderson-Darling Test will determine if a data set comes from a specified distribution, in our case, the normal distribution. The test makes use of the cumulative distribution function. The Anderson-Darling statistic is given by the following formula:
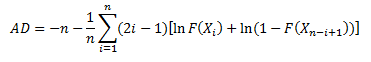
where n = sample size, F(X) = cumulative distribution function for the specified distribution and i = the ith sample when the data is sorted in ascending order. You will often see this statistic called A2.
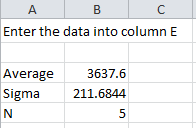
To demonstrate the calculation using Microsoft Excel and to introduce the workbook, we will use the first five results from the baby weight data. Those five weights are 3837, 3334, 3554, 3838, and 3625 grams. You definitely want to have more data points than this to determine if your data are normally distributed. We will walk through the steps here. You can download the Excel workbook which will do this for you automatically here: download workbook. Of course, the Anderson-Darling test is included in the SPC for Excel software.
The data are placed in column E in the workbook. After entering the data, the workbook determines the average, standard deviation and number of data points present The workbook can handle up to 200 data points.
The next step is to number the data from 1 to n as shown below.
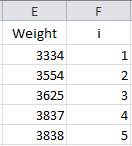
The formula in Cell F2 is "=IF(ISBLANK(E2),"",1)". The formula in cell F3 is "=IF(ISBLANK(E3),"",F2+1)". The formula in cell F3 is copied down the column.
To calculate the Anderson-Darling statistic, you need to sort the data in ascending order. This is done in column G using the Excel function SMALL(array, k). This function returns the kth smallest number in the array. The sorted data are placed in column G.
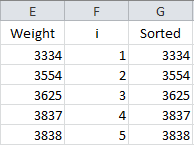
The formula in cell G2 is "=IF(ISBLANK(E2), NA(),SMALL(E$2:E$201,F2))". This formula is copied down the column. The NA() is used so that Excel will not plot points with no data.
Now we are ready to calculate F(Xi). Remember, this is the cumulative distribution function. In Excel, you can determine this using either the NORMDIST or NORMSDIST functions. They both will give the same result. We will use the NORMDIST function. The workbook places these results in column H.
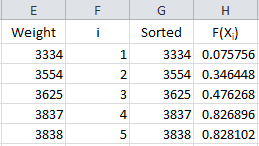
The formula in cell H2 is "=IF(ISBLANK(E2),"",NORMDIST(G2, $B$3, $B$4, TRUE))". This formula is copied down column H. The average is in cell B3; the standard deviation in cell B4. Using "TRUE" returns the cumulative distribution function.
Take a look again at the Anderson-Darling statistic equation:
We have F(Xi). The equation shows we need 1-F(Xn-i+1). It takes two steps to get this in the workbook. First the value of 1- F(Xi) is calculated in column I and then the results are sorted in column J. The results are shown below.
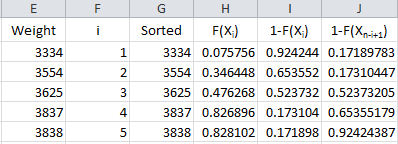
The formula in cells I2 is "=IF(ISBLANK(E2), "", 1-H2)" and the formula in cell J2 is "=IF(ISBLANK(E2),"",SMALL(I$2:I$201,F2))." These are copied down those two columns.
We are now ready to calculate the summation portion of the equation. So, define the following for the summation term in the Anderson-Darling equation:
![]()
This result is placed in column K in the workbook.
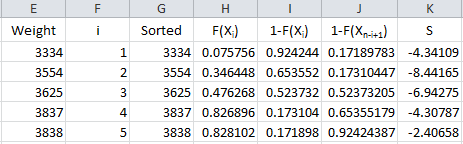
The formula in cell K2 is "=IF(ISBLANK(E2),"",(2*F2-1)*(LN(H2)+LN(J2)))". This formula is copied down the column.
We are now ready to calculate the Anderson-Darling statistic. This is given by:
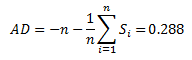
The value of AD needs to be adjusted for small sample sizes. The adjusted AD value is given by:
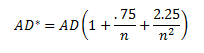
For these 5 data points, AD* = .357. The workbook has the following output in columns A and B:
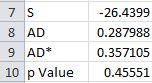
The last entry is the p value. That depends on the value of AD*.
The p Value for the Adjusted Anderson-Darling Statistic
The calculation of the p value is not straightforward. The reference most people use is R.B. D'Augostino and M.A. Stephens, Eds., 1986, Goodness-of-Fit Techniques, Marcel Dekker. There are different equations depending on the value of AD*. These are given by:
- If AD*=>0.6, then p = exp(1.2937 - 5.709(AD*)+ 0.0186(AD*)2
- If 0.34 < AD* < .6, then p = exp(0.9177 - 4.279(AD*) - 1.38(AD*)2
- If 0.2 < AD* < 0.34, then p = 1 - exp(-8.318 + 42.796(AD*)- 59.938(AD*)2)
- If AD* <= 0.2, then p = 1 - exp(-13.436 + 101.14(AD*)- 223.73(AD*)2)
The workbook (and the SPC for Excel software) uses these equations to determine the p value for the Anderson-Darling statistic.
Applying the Anderson-Darling Test
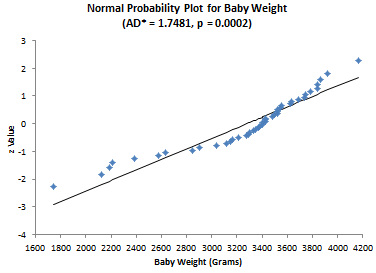
Now let's apply the test to the two sets of data, starting with the baby weight. The question we are asking is - are the baby weight data normally distributed?" The results for that set of data are given below.
AD = 1.717
AD* = 1.748
p Value = 0.000179
The p value is less than 0.05. Since the p value is low, we reject the null hypotheses that the data are from a normal distribution. You can construct a normal probability plot of the data. How to do this is explained in our June 2009 newsletter. The normal probability plot is included in the workbook. If the data comes from a normal distribution, the points should fall in a fairly straight line. You can see that this is not the case for these data and confirms that the data does not come from a normal distribution.
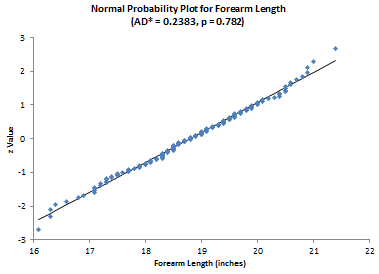
Now consider the forearm length data. Again, we are asking the question - are the data normally distributed? The results for the elbow lengths
AD = 0.237
AD* = 0.238
p Value = 0.782045
Since the p value is large, we accept the null hypotheses that the data are from a normal distribution. The normal probability plot shown below confirms this.
The workbook contains all you need to do the Anderson-Darling test and to see the normal probability plot.
Summary
The Anderson-Darling test is used to determine if a data set follows a specified distribution. In this newsletter, we applied this test to the normal distribution. The test involves calculating the Anderson-Darling statistic and then determining the p value for the statistic. It is often used with the normal probability plot.
Quick Links
Thanks so much for reading our publication. We hope you find it informative and useful. Happy charting and may the data always support your position.
Sincerely,
Dr. Bill McNeese
BPI Consulting, LLC
![]()
Connect with Us
SPC Knowledge Base

Sign up for our FREE monthly publication featuring SPC techniques and other statistical topics.
Customer Stories
Click here to see what our customers say about SPC for Excel!
SPC Around the World
SPC for Excel is used in 80 countries internationally. Click here for a list of those countries.
Comments (53)
awesome article !
Very Illustrative, Easy to adopt and enables any to tackle similar issues irrespective of age, education & position
Thanks for the info.
You will never know how much you helped!
Well explained topic, thanks
Very well explained in places, slightly ambiguous in others. Shame about the grammar used throughout the piece!
And what is wrong with the grammar? Ready fine to me!
How Anderson-Darling test is different from Shapiro Wilk test for normality?
I have seen varying data on which approach is better - have seen where Shapiro-Wilk has more power. But, I have not looked too much into the Shapiro-Wilk test.
Hi. This is really usefull thank you. However is there any way to increase the amount of data that can be analysed in this workbook? I've got 750 samples. I did change the maximum values in the formulas to include a bigger data sample but wasn’t sure if the formulas would be compromised.e.g E$701 =IF(ISBLANK(E2), NA(),SMALL(E$2:E$1000,F2))
You can use the workbook with larger sample sizes. You just need to be sure that it is changed in all formulas, including Avg, stdev, n, S and the ones containing SMALL.
Hi, Thanks for the info. I'm reproducing the steps in Excel but I don't want to compare with a Normal distribution, I have my own set of data and I want to check it with my own distribution. In this case how do generate F(Xi) using 10,000 data points I have for the distribution?
I am not sure I understand what you want to do. Maybe this:
In Column B, put the numbers from 1 to 10,000
In cell C1, enter = B1/10000
Copy that from C2 to C10000
Plot A vs C to generate the CDF
Is it possible to explain the correction in the calculation of the Z-value (see column L of sheet 2 in the embedded excel-sheet). The P value is not calculated as i/n. But corrected and is now calculated as (i-0,3)/(n+0.4) Is it possible to give some substantiation of the used 0.3 and 0.4.
The method used is median rank method for uncensored data. This gives p = (i-0.3)/(n+.4). There are other methods that could be used. For example, you could use (i-0.5)/n; or i/(n+1) or simply i/n.
Thanks
This is really very informative article.I come to know about this useful test.thanks
Hi great article!! Can this be adapted for the lognormal distribution, I tried altering the formula in column H but it gave me some odd looking results (p =1)?Many Thanks
Thank you. Yes, it can be adpated to calculate the Anderson-Darling statistics; however the p value calculation changes depending on type of distribution you are examining. The SPC for Excel software uses the p value calculations for various distributions from the book Goodness-of-Fit Techniques by D'Agostino and Stephens.
Hi! Please tell me how the p-value is determined. Thanks!
The p values come from the book mentioned above. They are in tabular form usually. If your AD value is from x to y, the p value is z.
You said that the value of AD needs to be adjusted for small sample sizes. What is the range of number of data for it to be considered "small"? Thank you. By the way, this article is awesome! :)
Thanks for hte comments. I usually use the adjusted AD all the time. As n gets very large, they become the same.
Hi! I have two sets of data and Im going to know their significant difference using z-test. I know that z-test requires normally distributed data. Should I determine the p value for both the two data or for each set? Thanks!
You can do that. How big is your sample size? If it is too small, you might get an inaccurate result from doing this test. If the sample size is too large, the z test may show a difference that is really not significant from a usefulness view. Use your knowledge of the process. Is there any reason to believe that the data would not be normally distributed?
no reason really. but in our thesis, it is necessary to determine first if the data are normally distributed or not through the p value... we 150 sample size for each.. since i have two sets of data do u think that p-value should be determine from each set of data? and why is that?
If you have 150 data point sfor each set, I would start with a histogram. If it looks somewhat normal, don't worry about it. If not, then run the Anderson-Darling with the normal probablity plot. You do with both sets of data since I assume they come from 2 different processes.
Very Helpfull informationTKS!!!
Great Article. Thank you.
The text gives a value for AD statistic as "2.88" whereas the Excel sheet states "2.37". What's correct?
The text has the AD as 0.237 as well as the workbook. I don't see a 2.88 anywhere in the text.
This article was really useful, thank you!! The workbook made it super easy to follow along with the steps and
Awesome!Top quality stats lesson - will return in future. Thanks.
Nice Article on AD normality test.
Thank you so much for this article and the attached workbook! It makes the test and the results so much easier to understand and interpret for a high school student like me. This has helped me a lot in a research project I did where I tested if the probability of successfully shooting three-pointers in basketball was normally distributed.
This is extremely valuable information and very well explained. This greatly improved my understanding of testing normal distribution for process capability studies. Thanks for making this available for novices like myself.
Hello, this is a very usefull article. But i have a question. I have 1800 data points. My value for AD is 10 and my S is aprox. 3.500.000 are those high numbers normal or might there be a mistake on my behalf? My p value is 2,1*10^-24 which even for this test seems a bit low. If i plot all Points they are very close to the line in the middle. Thanks again for the article.
The Anderson-Darling test is not very good with large data sets like yours. Large data sets can give small pvalues even if from a normal distribution. I would just do a histogram and ask if it looks bell-shaped. All the proof you need i think,
It does look Bell shaped. Thats the reason I tested with the Anderson Darling test. The problem with a just optic Test like looking at a histogram is that its not scientific and i have to write a paper on it. Can you recomend a diffrent test for such big data sets?
Not really; large data sets tend to make many tests too sensitive. I would suggest you fit a normal curve to the data and see what the p-value is for the fit. That would be more scientific i guess - but if it looks normal, i would be suspect of any test that says it is not normal.
Hello, this is super article. But i have a problem.I trayed use the VBA code form link in the article but as result I have only some thing like this -85,0097 in cell with function for this sample od data:23,78723,79523,70823,80923,83923,78523,75723,798 23,71How to get S, AD, ADstar and Pvalue??Thanks in advance.
The data are running together. Can you send the data to me in an excel spreadsheet please? bill@spcforexcel.com
Can you please tell me what changes need to be made if the distribution changes? Let's say, my data is known to follow Weibull distribution, how does the calculation of p-value and Anderson Darling differs? Does the p-value and the Anderson-Darling coefficient calculation remains the same?
The p value and Anderson Darling coefficient are dependent on the distribution you are testing.
I have another question. What's the case when the data is right censored? Does these calculations change?
I have not looked into right censored data, so I don't have an answer for you.
Great article, simple language and easy-to-follow steps.I have one qeustion, what if I want to check other types of distributions? Is there a function in Excel, similar to NORMDIST(), for other types of distributions?
Yes. You can see a list of all statistical functions in Excel by going to Formulas, More Functions, and Statistical. Our software has distribution fitting capabilities and will calculated it for you automatically.
Yes. You can see a list of all statistical functions in Excel by going to Formulas, More Functions, and Statistical. Our software has distribution fitting capabilities and will calculated it for you automatically.
I AM VERY IMPRESSED WITH YOUR ELABORATIONS. THANK YOU. DR. KAVITHA MOHANDAS
Hello Dr. Bill,I've turned into a long-term following of your YouTube videos and posts on your webpage; the content is insightful and helpful. I have been reading and studying as much as I can online about the Anderson Darling Normal Probability Plot and keep venturing back to your website to learn.In the below link you mentioned the P-Value needs to be >.20. "If the p-value (probability) for the Anderson-Darling statistic is less than 0.05, there is statistical evidence that the data are not normality distributed. If the p-value is greater than 0.20, the conclusion is that the data are normally distributed." I've heard you mention several times in your videos about P-Value >.200 and I want to understand more.Normal Probability Plot Help | BPI Consulting (spcforexcel.com)So my question is; what makes a P-Value threshold level of >.200 so significant? I enjoy your content and YouTube videos, keep up the good work! I looked forward to your response, cheers!
Pages
Leave a comment